At Fowler Drew, clients’ achieved performance is the product of a quantitative (algorithm-driven) approach to asset allocation, implemented using low-cost trackers. Our skill is in the construction of the decision rules and in how we implement them cost-effectively and tax-efficiently.
Discretionary clients’ returns from the equity component of their portfolios is the only common denominator of the firm’s performance when asset allocation between risky and risk free assets is dynamically matched to idiosyncratic risk tolerance and time horizons. This is what happens when clients choose a Liability Driven Investment approach, with risk being controlled by combining hedges and bets to achieve outcomes within defined tolerances, rather than a conventional portfolio approach in which outcomes are secondary to controlling portfolio volatility, or path risk, by maximising diversification between different types of risky asset. Diversification relies on the assets not moving closely together over short periods, which may or may not be the case in fact.
Only clients with very long time horizons and/or very high tolerance of outcome uncertainty will hold 100% in equities. But for those that do, the equity exposure is geographically diversified without a bias to the UK. Exposure is therefore spread, more evenly than in size-weighted global equity indices, across the UK, US, Europe (ex UK), Japan, and (possibly but not always) Australia and Emerging Markets.
Where equity risk is being diluted by risk free hedges (cash, inflation linked National Savings and Index Linked Gilts) matched to relatively near-term consumption horizons, they still hold a proportion of the 100% equity portfolio. Reported performance includes both the risky and risk free elements but the return contribution of the dilution element is not a strategy decision made by Fowler Drew and is not a reflection on our skill or the skill of our quantitative model. It reflects a prior risk choice made by the client.
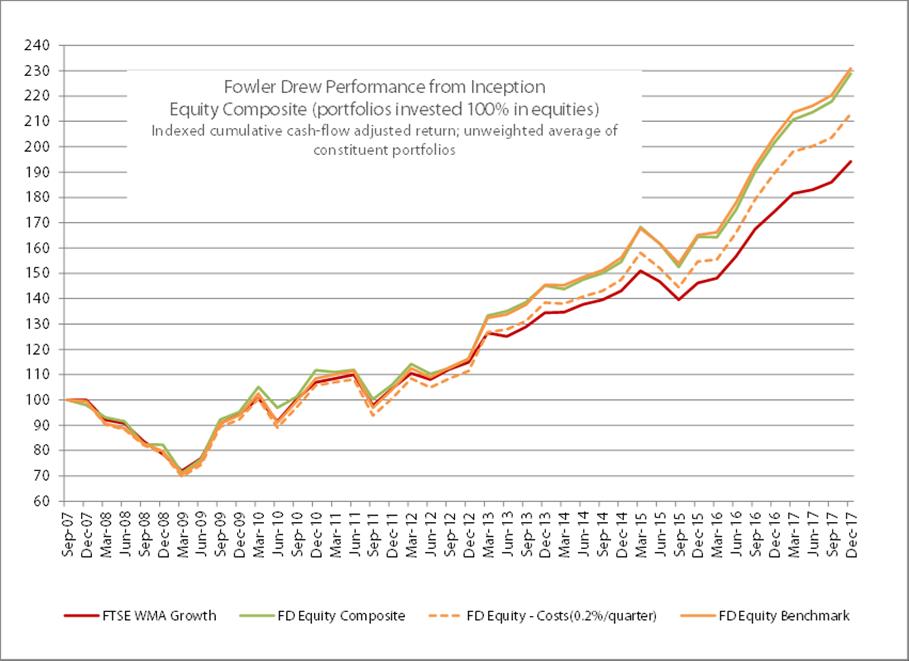
However, we can use the performance of our 100% equity portfolios to measure the skill in constructing the risky element of the portfolio, which is entirely our choice. This is what the chart shows.
There are two contributions to that possible skill:
- Any permanent construction bias – as a policy decision affecting the portfolio makeup regardless of market conditions at any one time
- The added value of tactical movements based on market conditions.
The FD Equity Benchmark (the orange plot in the chart above) is a measure of the first, structural, contribution. The weightings in this benchmark index are derived from the observed historical trend real returns and the observed risk of the market. So they are optimal weights based on risk-adjusted expected long-term real returns. The weights change very little over time because the observed values of return and risk are fairly stable. They share the characteristic noted above that they are unbiased by market size and there is no bias to the UK as ‘home market’.
The benchmark return is rebalanced each quarter to fixed weights. There is an implicit cost to rebalancing that is absent from most composite indices: you could not actually achieve those returns. We calculated this transaction cost to be about 0.2% per quarter. The cost-adjusted benchmark is shown as the broken orange plot.
The added value of our chosen weights, reflecting expected returns different from the trend, can then be estimated by comparing actual returns (in green) with this cost-adjusted benchmark. Whereas actual performance appears to be explained fully by the structural bias (the two lines track closely), when transaction costs are taken into account we have added significant value by assessing actual market conditions.
How should Fowler Drew equity performance be compared with conventional management, as represented by typical risk-targeted diversification strategies? Our chosen measure for this purpose, which captures the effects of choosing our Liability Driven and outcomes-focused approach over the typical industry approach, is to use the nearest equivalent FTSE Wealth Management Association benchmark, which (if comparing with a 100% equity portfolio) has to be the Growth Index. This is shown as the red plot. It has a bias to the UK and the international equity component is size-weighted rather than unbiased.
Note, though, that FTSE WMA Growth is also a fixed-weight composite which does not show implied transaction costs of rebalancing regularly from the ‘new’ weights (resulting from different returns earned) to the fixed weights. Though we cannot estimate these costs as accurately as for our own index, we might assume a higher cost than 0.2% per quarter because some of the asset classes held are less liquid (corporate bonds, hedge funds, commercial property).
Conclusions
- Over the whole period the Fowler Drew composite has delivered higher returns than the industry benchmark, even without allowing for the cost-free rebalancing effects of the latter.
- Just over half the outperformance is due to our systematic construction differences.
- The rest is due to the added value from our own observations of how actual market conditions differed from the ‘normal’ observations used in our own benchmark.
Note on the composite
The composite Fowler Drew 100% equity population is made up of an unweighted average of all portfolios following this model, adding every new portfolio as soon as deployment from legacy holding to the model holdings is complete (usually less than one quarter). Dispersion between members is very small and largely accounted for by differences in the valuation points for different index-tracking unit trusts and for trackers generally relative to ETFs. These timing differences are minimised over time.
We only take transaction costs into account because our flat fee for discretionary management may be calculated across multiple goal-based portfolios and the choice of account or wrapper from which we take the flat fee is typically optimised for tax. Total costs are reported separately, without being assigned to any one goal-based, virtual portfolio (e.g. a portfolio managed to deliver outcomes planned for one or more individuals with resources contributed by different individual and held in different accounts or wrappers whose legal owners are those contributing individuals).
For most clients, total discretionary management fees when expressed as a percentage of assets under management are significantly lower than typical industry averages. This is how we pass on most of the cost savings of a quantitative approach. Platform costs are also cheaper than most. We are not therefore flattering our relative performance compared with other managers by keeping our flat fee out of the composite.